Recently, I asked you to send me your questions about buying and selling real estate. Ale asked about the pros and cons of selling your current house before buying the next one. He also asked about doing a rent-back.
First of all, if you have a house and want to buy another one, selling your current home first is a great way to go. You’ll have time to clean up your house and put it on the market. Plus, once your home sells, you will have enough money in your pocket to purchase another home. Since you are all ready to go, purchasing your next home will go a lot smoother.
Although it is more difficult to buy a new home before selling your current one,
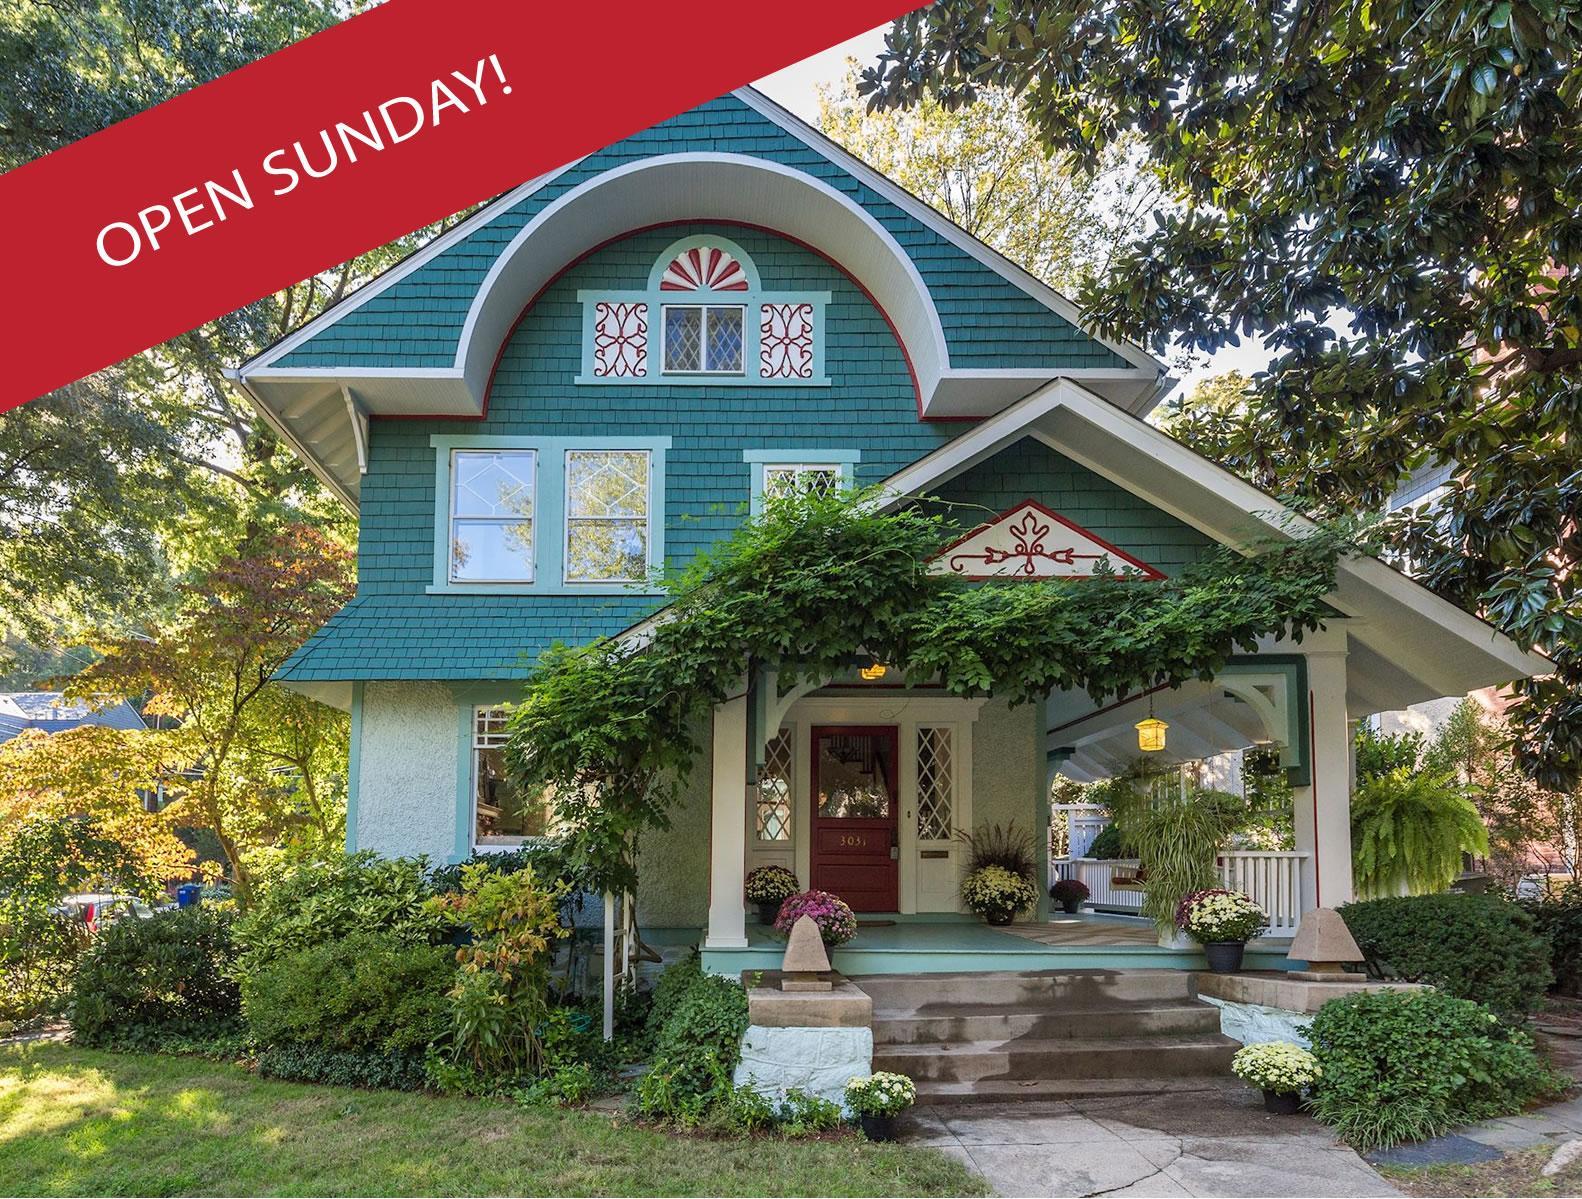
Historic Sherman cottage built in 1909. 4 bedrooms, 4 1/2 baths with wraparound front porch. Entry foyer, living room with fireplace, formal dining room & expanded kitchen with skylights. Patio, separate pool house with "endless pool" & 2 car parking. Located on the corner of Macomb and Ross Place in the heart of the Cleveland Park.
Visit www.3031Macomb.com for architectural photos and color floor plan.
Please stop by...OPEN 1-4pm Saturday, October 22nd
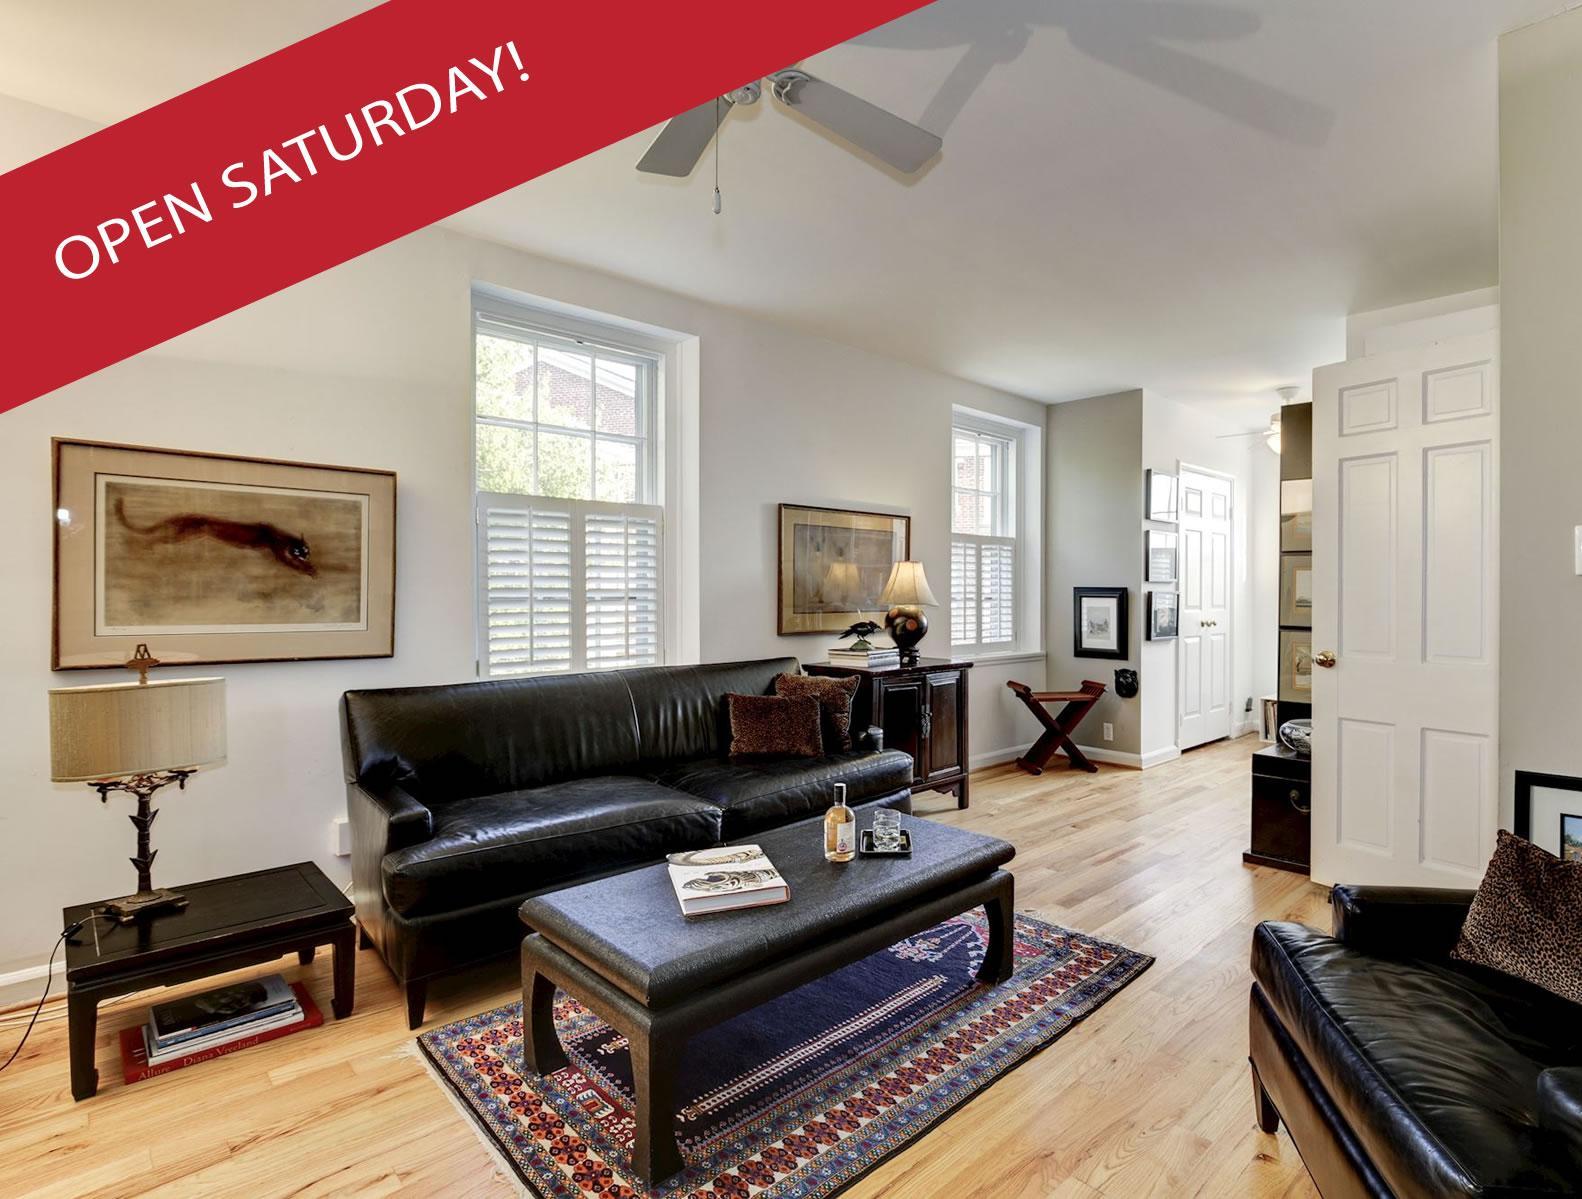
3850 Rodman Street, Washington, DC 20016
Luxurious updated 2 Bedroom/loft. Lives like a treehouse, on the main level you will find a huge master bedroom with dressing area, oversized full bathroom, large living room, dining area & kitchen with window. Upstairs is flexible space, could be a bedroom plus den, high cathedral ceiling, 3 skylights, great bedroom closet, fan window & lots of extra storage. Hardwood floors throughout, central A/C, designer shutters on windows & skylights. Unlike anything you've seen at McLean Gardens. 1 dog, 2 cats, or 1 dog plus 1 cat permitted.
Amazing location, public dog park, tennis court, playgrounds, restaurants & shops, Giant, CVS, community garden, parkland
Recently there has been a lot of talk about home prices and if they are accelerating too quickly. In some areas of the country, seller supply (homes for sale) cannot keep up with the number of buyers out looking for a home, which has caused prices to rise.
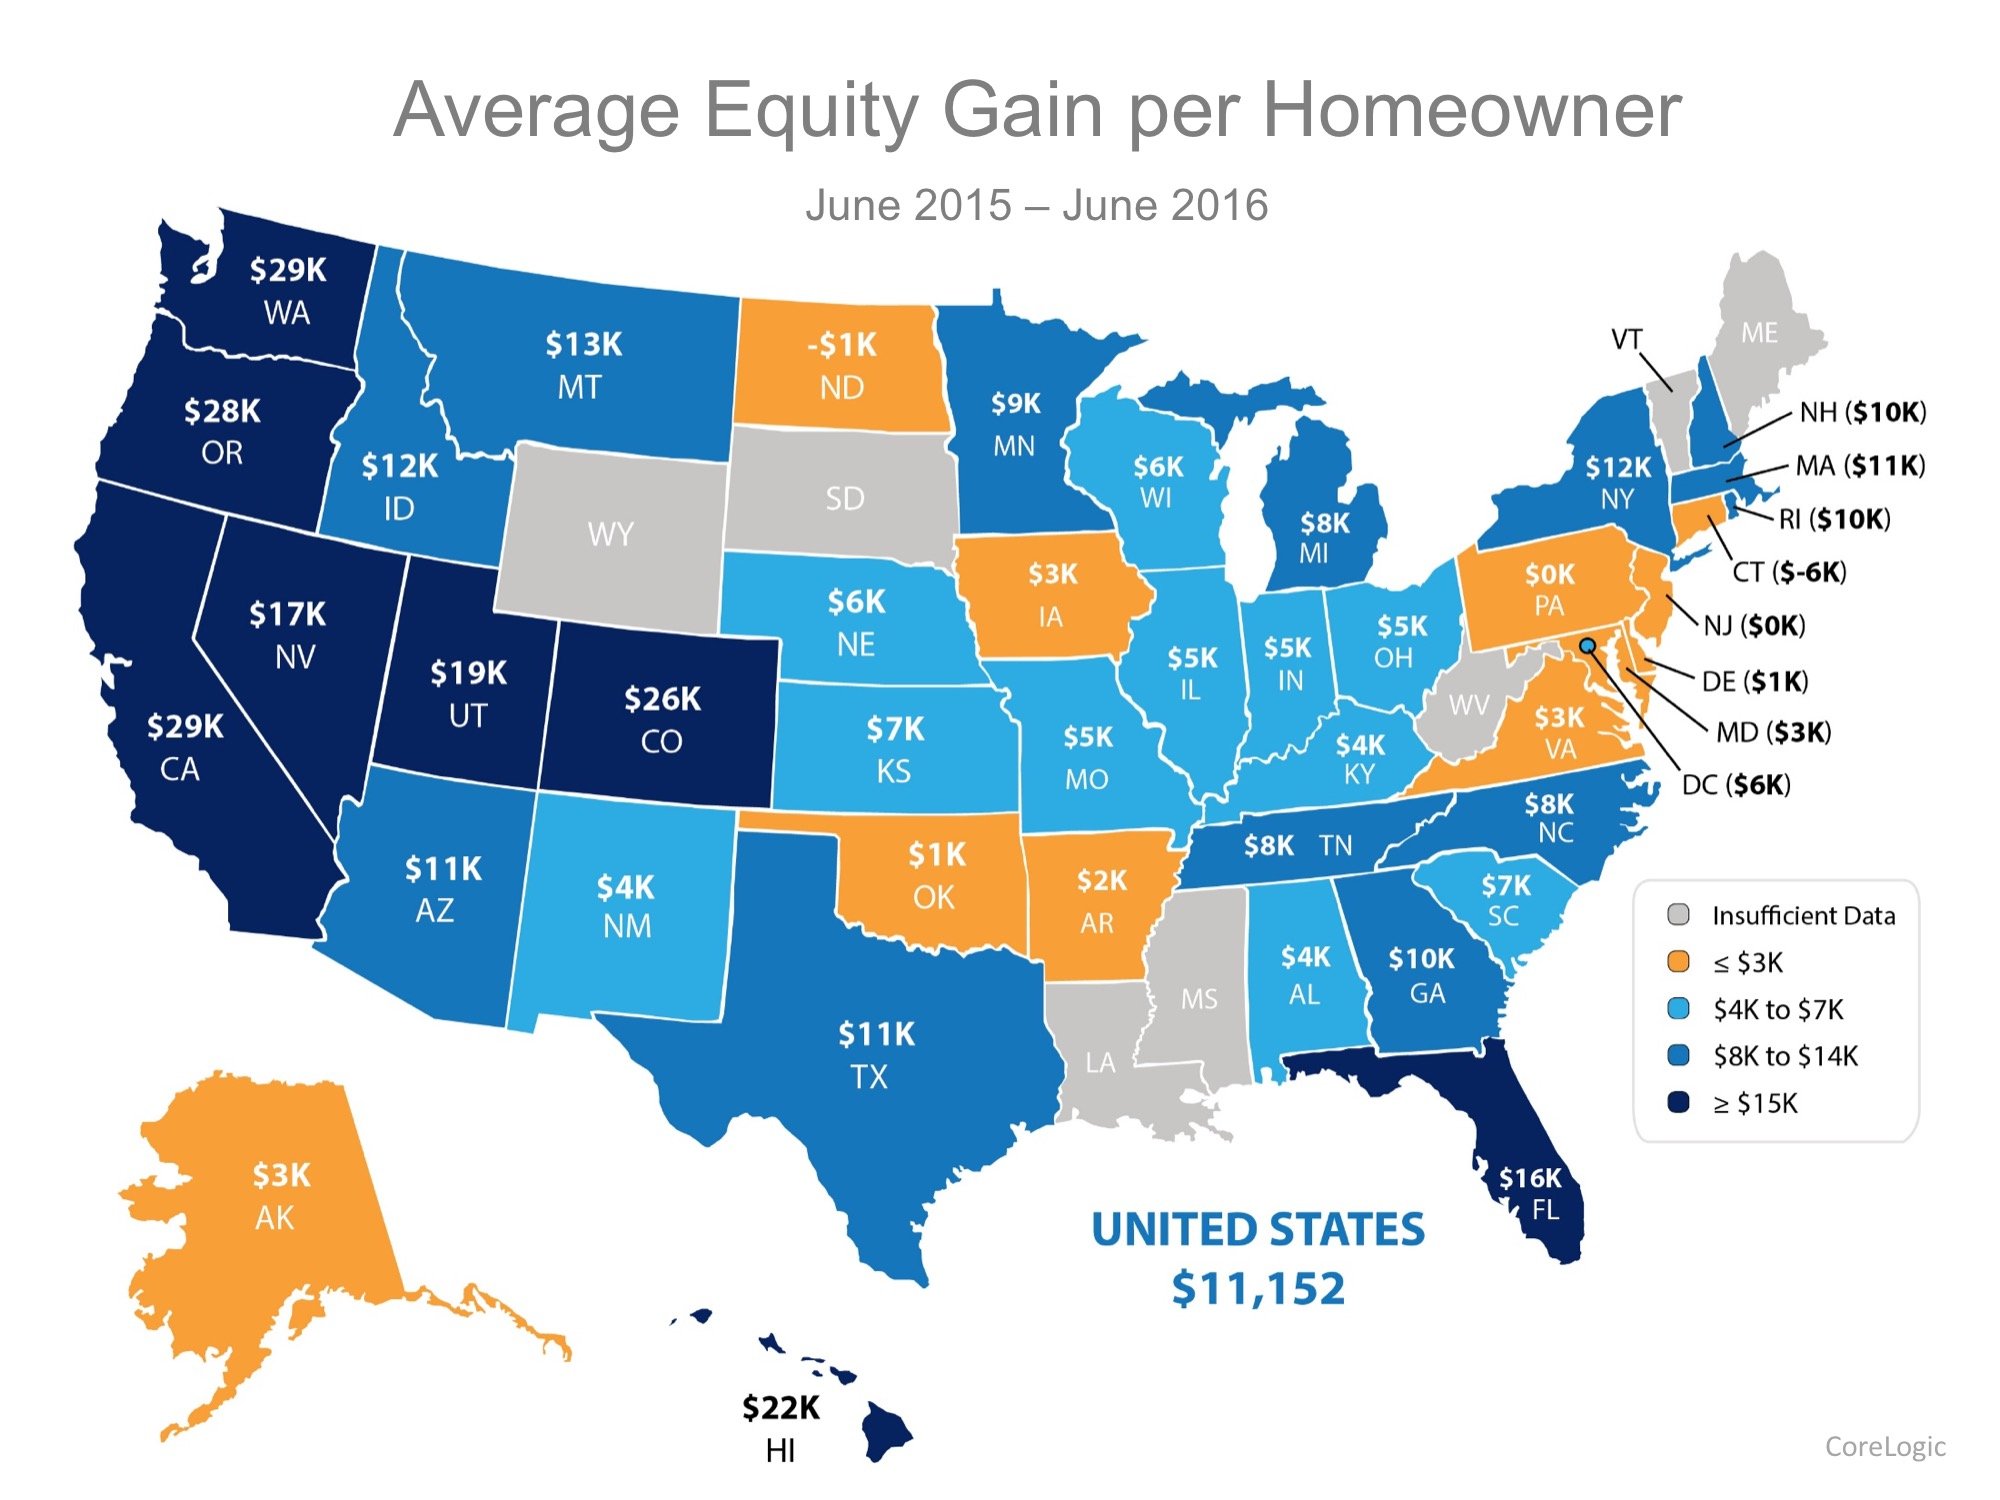
The great news about rising prices, however, is that according to CoreLogic’s latest US Economic Outlook, the average American household gained over $11,000 in equity over the course of the last year, largely due to home value increases.
The map below was created from CoreLogic’s report and shows the average equity gain per mortgaged home from June 2015 to June 2016 (the latest data available).
For those that are worried that we are doomed to repeat 2006 all over again, it is important
According to Freddie Mac’s latest Primary Mortgage Market Survey, interest rates for a 30-year fixed rate mortgage are currently at 3.47%. Rates have remained at or below 3.5% each of the last 16 weeks, marking a historic low.
The interest rate you secure when buying a home not only greatly impacts your monthly housing costs, but also impacts your purchasing power.
Purchasing power, simply put, is the amount of home you can afford buy for the budget you have available to spend. As rates increase, the price of the house you can afford will decrease if you plan to stay within a certain monthly housing budget.
The chart below shows what impact rising interest rates would have if you planned to purchase a home within the national median price
A Fairy Tale Cottage on Macomb Offers Vintage Touches
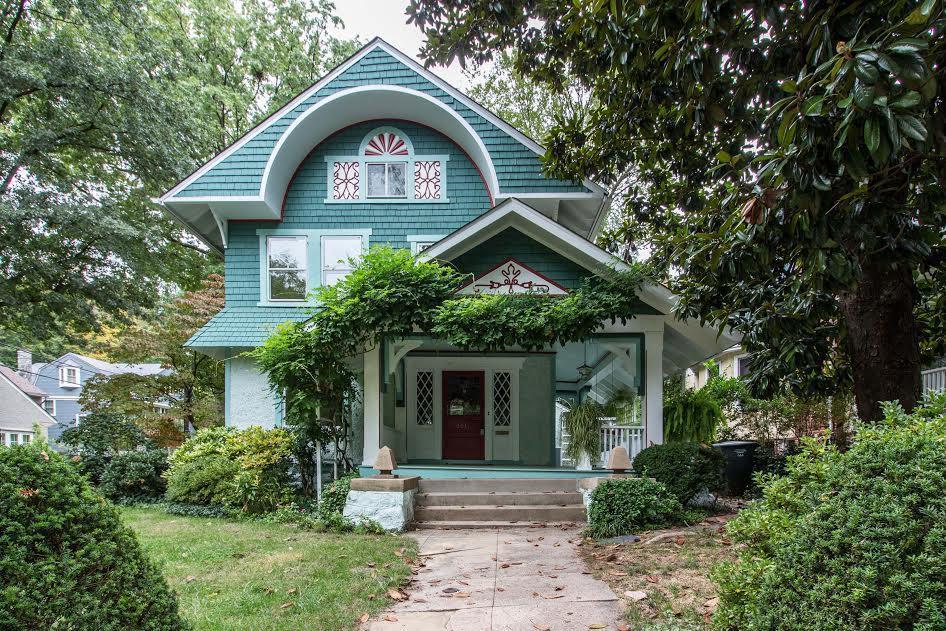
Back in the day, long before “tiny houses” and other architectural oddities were a thing, there were Sherman cottages - fairy tale structures based on the Arts and Crafts style. Built at the turn of the last century, these homes featured such decorative elements as angled windows, unusual rooflines, rope-dipped-in-plaster trim, and conservatories that gave each home its own distinctive profile.
Designed by Ella Sherman for one of the original Cleveland Park subdivisions in 1909, this 2,485 square foot seafoam stucco and shingle cottage at 3031 Macomb St. NW has four bedrooms, four full bathrooms, and one half-bath, a large curved porch, a pool house, off-street parking, and abundant charm.
The results of countless studies have shown that potential home buyers, and even current homeowners, have an inflated view of what is really required to qualify for a mortgage in today’s market.
One such study by the Wharton School of Business at the University of Pennsylvania, revealed that many Millennials have not yet considered purchasing a home, simply because they don’t believe they can qualify for a mortgage.
The article quoted Jessica Lautz, the National Association of Realtors’ Managing Director of Survey Research, as saying that there is a significant population that does not think they will be approved for a mortgage and doesn’t even try. The article also quoted Fannie Mae CEO Tim Mayopoulos:
In today’s housing market, where supply is very low and demand is very high, home values are increasing rapidly. Many experts are projecting that home values could appreciate by another 5%+ over the next twelve months. One major challenge in such a market is the bank appraisal.
If prices are surging, it is difficult for appraisers to find adequate, comparable sales (similar houses in the neighborhood that closed recently) to defend the selling price when performing the appraisal for the bank.
Every month, Quicken Loans measures the disparity between what a homeowner believes their house is worth as compared to an appraiser’s evaluation in their Home Price Perception Index (HPPI).Here is a chart showing that difference for each of the last 12


![7 Graphs That Show the Real Estate Market is Back! [INFOGRAPHIC] | Simplifying The Market](http://www.simplifyingthemarket.com/wp-content/uploads/2016/10/20161021-STM-1.jpg)
.jpg)


![Do You Know the Cost of Renting vs. Buying? [INFOGRAPHIC] | Simplifying The Market](http://www.simplifyingthemarket.com/wp-content/uploads/2016/10/20161014-Rent-vs.-Buy-STM.jpg)