
July 2016 Washington, DC Market Trends Report
Posted by Marjorie Dick Stuart on Tuesday, August 16th, 2016 at 12:30pm.
 OVERVIEW
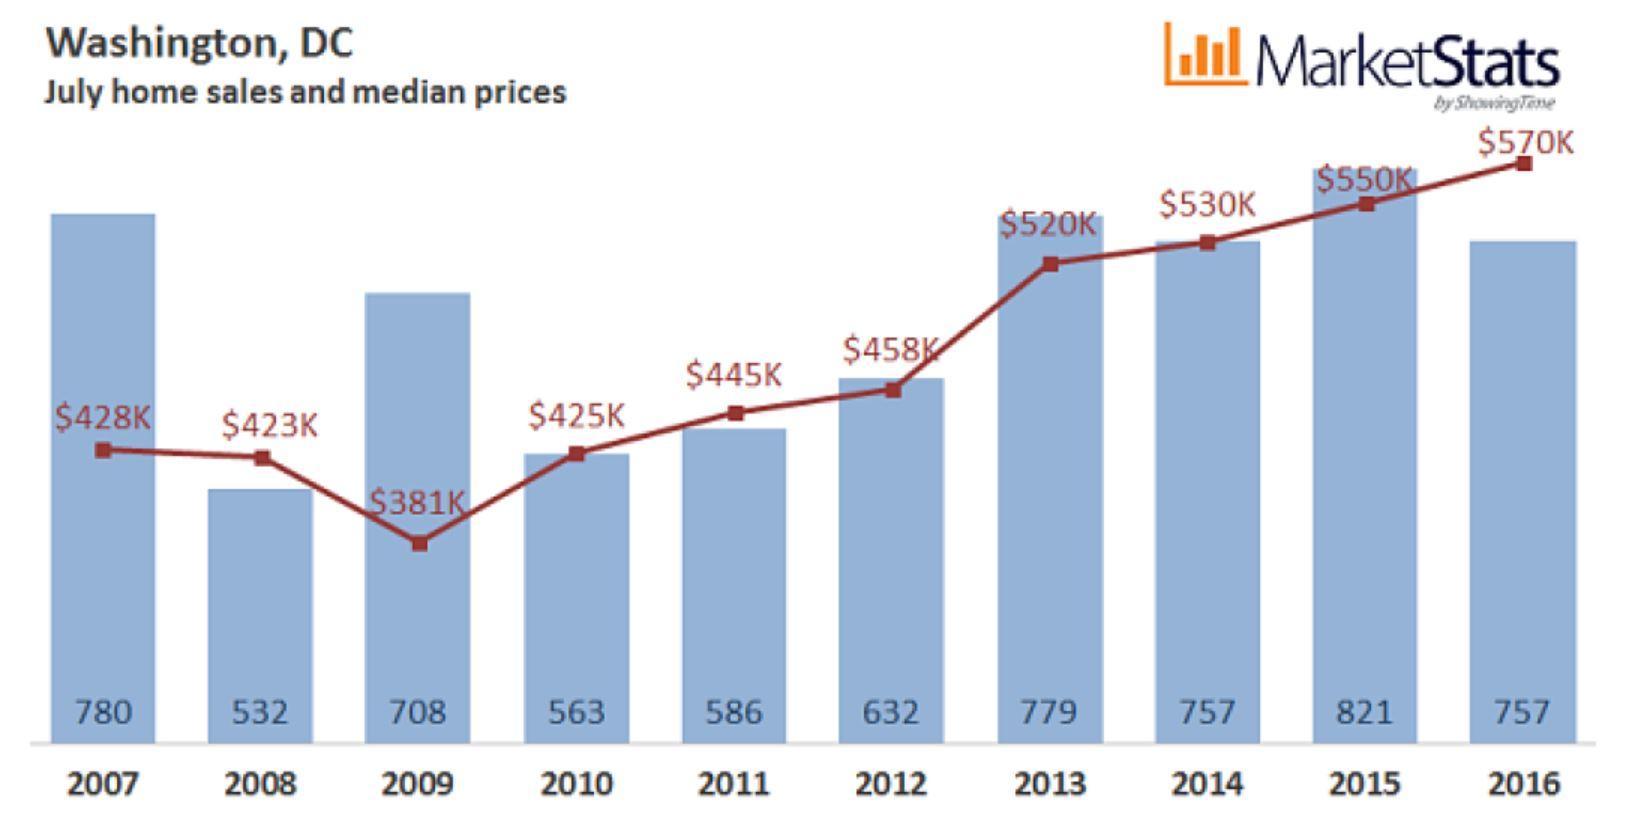
July’s median sales price gained 3.6 percent from last year to $570,000, tying the highest July median sales price on record. The 757 closed sales in July represented a 7.8 percent decrease versus last year. New pending sales increased by 1.3 percent overall with gains in the detached home segment but a loss in the Townhouse segment and no change in the Condo/Coop home type segment. New listing activity decreased 0.4 percent compared to last July. Based on the average sales pace over the past twelve months, the 1,263 active listings represent only 1.9 months of supply, which continues to put sellers in an advantageous position. Half the homes sold in July were on the market for 11 days or less and the competition among buyers kept the average percent of asking price nearly flat at 99.0 percent.
KEY TRENDS
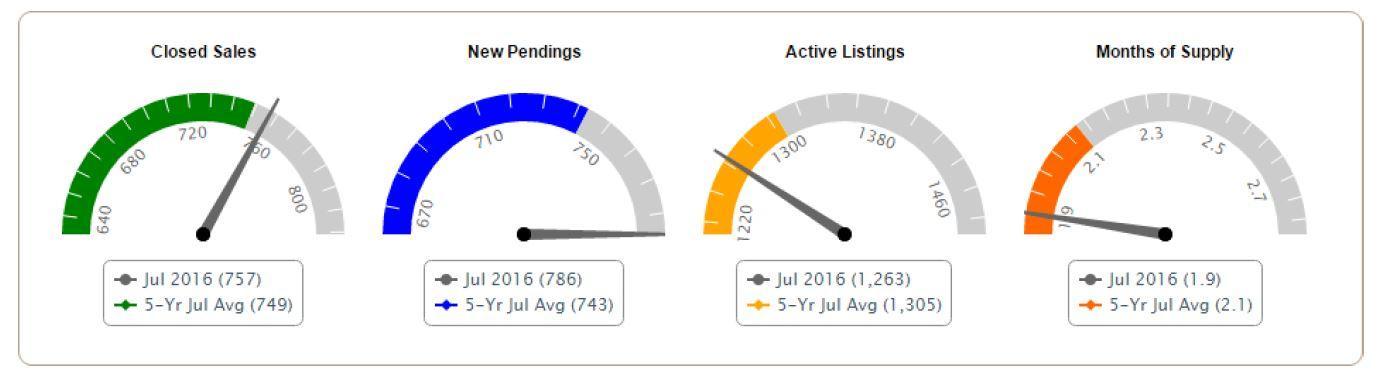
- Closed sales. The 757 July sales represented a 7.8 percent decrease versus last year, though it exceeded the five-year July average by 12 sales. The 4,976 cumulative year-to-date sales are 4.3 percent more than the number sold over the same period last year.
- Contract activity. There was a 1.3 percent spike in contract activity compared to last July. The 786 overall new pending sales topped the five-year July average by 5.8 percent.
- Listing activity. The number of new listings decreased 0.4 percent compared to last July. The 946 new listings added fell short of last July’s total by 4 listings, but exceeded the five-year July average by 62 listings (+7.0 percent).
- Inventory. Inventories in the District decreased compared to last year for the first time in 10 months. The 1,263 active listings at month’s end are .5 percent less than at the same point last year.
- Months of Supply. Supply remains scarce relative to demand, continuing to drive a strong seller’s market in the District. The 1,263 active listings represent just 1.9 months of supply.
- Prices. July’s median sales price was $570,000, a 3.6 percent increase over last year’s median of $550,000 and the highest July level on record.
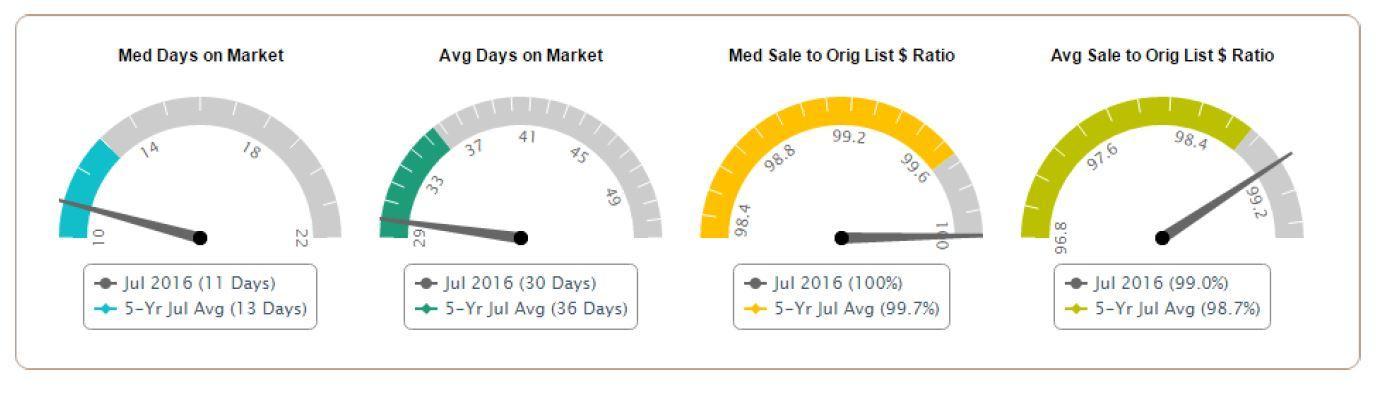
- Days on Market (DOM). Half the homes sold in July were on the market 11 days or less prior to contract, remaining steady with the pace of July 2015.
- Sales Price to Original List Price Ratios (SP to OLP). July sellers received 99.0 percent of original list price on average, down only 0.5 percent from the mark last July, just below the top level seen in the DC Metro region.
ANALYSIS BY HOUSING SEGMENT
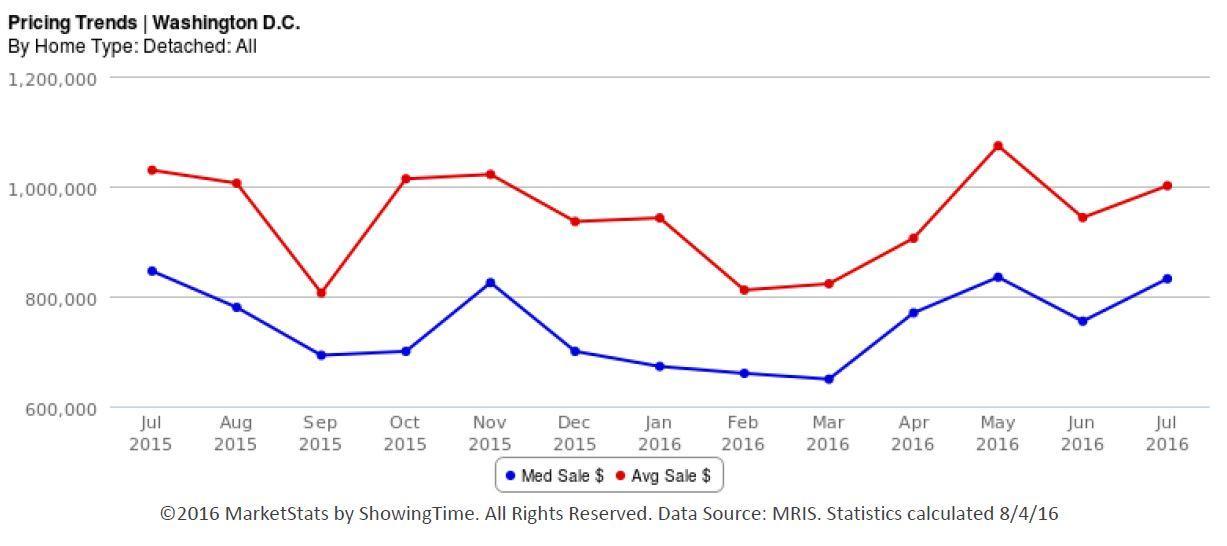
Single-Family Detached
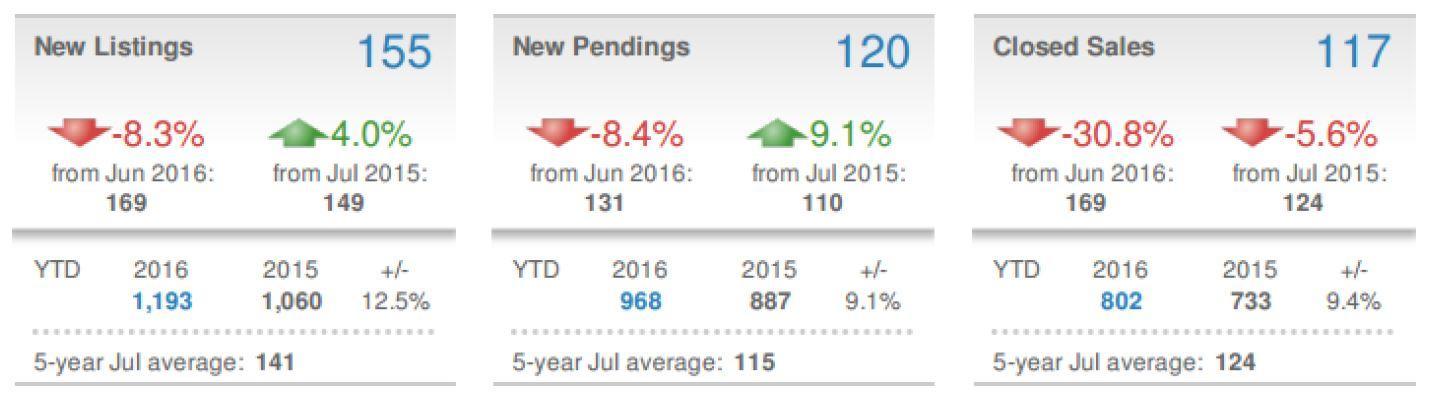
- The 117 detached homes sold in July dipped 5.6 percent compared to July 2015. The 120 new pending sales, however, entered during the month marked a year-over-year gain of 9.1 percent.
- As more potential sellers are realizing the strength of this seller’s market, new listing activity increased. The 155 new listings added were 4.0 percent more than the number added in July 2015. Active inventory at month’s end (257) is slightly higher than the 245 listings last year.
- The 257 active listings represent 2.4 months of supply based on the average sales pace of the last 12 months, slightly less than the 2.5 months of supply from the seller’s market of July 2015.
- The average days-on-market (DOM) for detached properties sold in July was 35 days, a decrease of 10 days. Half of the detached homes sold were on the market for 12 days or less, a nine-day decrease compared to last July.
- The average price per square foot for detached homes was $486, a depreciation from the $468 average for detached sales last July.
- The median sales price for detached properties in July was $832,000, a decrease of $14,000 (1.7 percent) from last July’s mark. The year-to-date median of $750,000 is 1.7 percent lower than the $763,000 level through the first seven months of 2015.
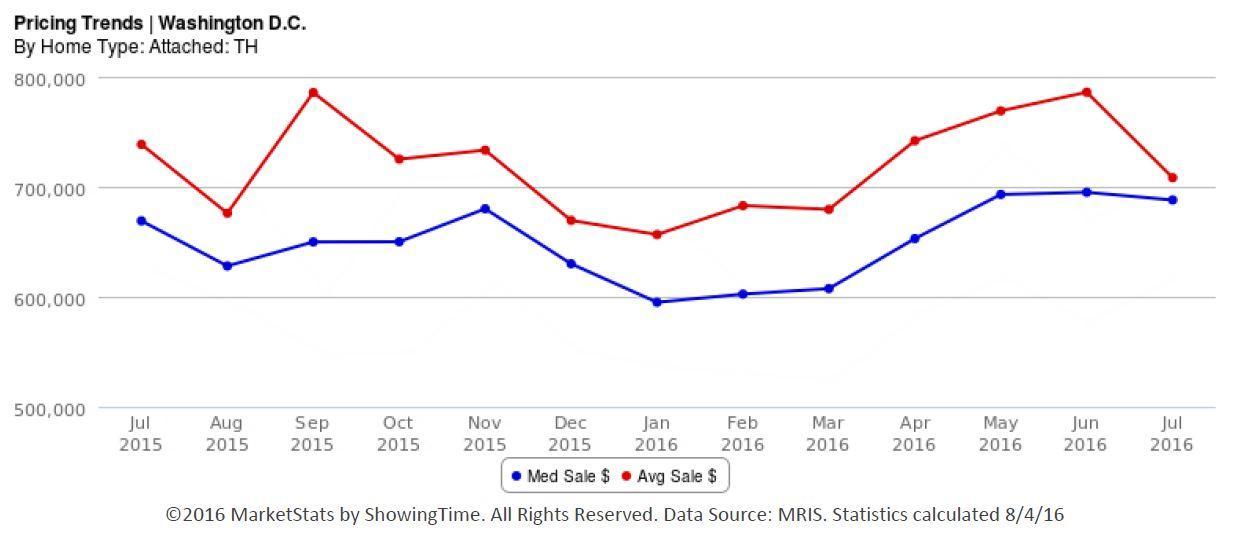
Single-Family Attached (Townhouses)
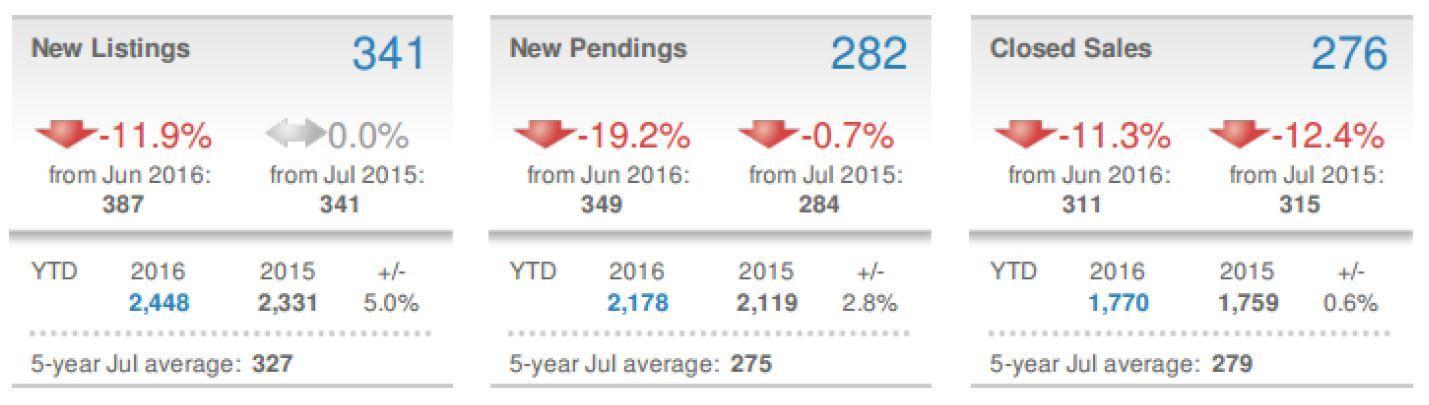
- The 282 new pending sales of townhouses were 0.7 percent less than last July.
- There were 341 new listings added in July, remaining flat with last year’s new listings. Active townhouse inventories at month’s end were up 12.8 percent from last year.
- The 388 active listings represent only 1.6 months of townhouse supply, making it the segment with the strongest seller’s market.
- The average days-on-market (DOM) for townhouses sold in July was 22 days, compared to 24 at this time last year. Half of the townhouses sold were on the market for nine days or less, exactly the same as last July.
- The average sales price per square foot for District townhouses in July was $477, representing a depreciation of 2.9 percent versus the $491 average last July.
- The median sales price for townhouses in July was $688,000, a 2.8 percent increase from last year’s July-level of $669,000. The year-to-date median of $651,325 up 3.1 percent versus 2016. The average sales price in July was $708,355, a 4.1 percent decrease from last year’s mark of $738,574.
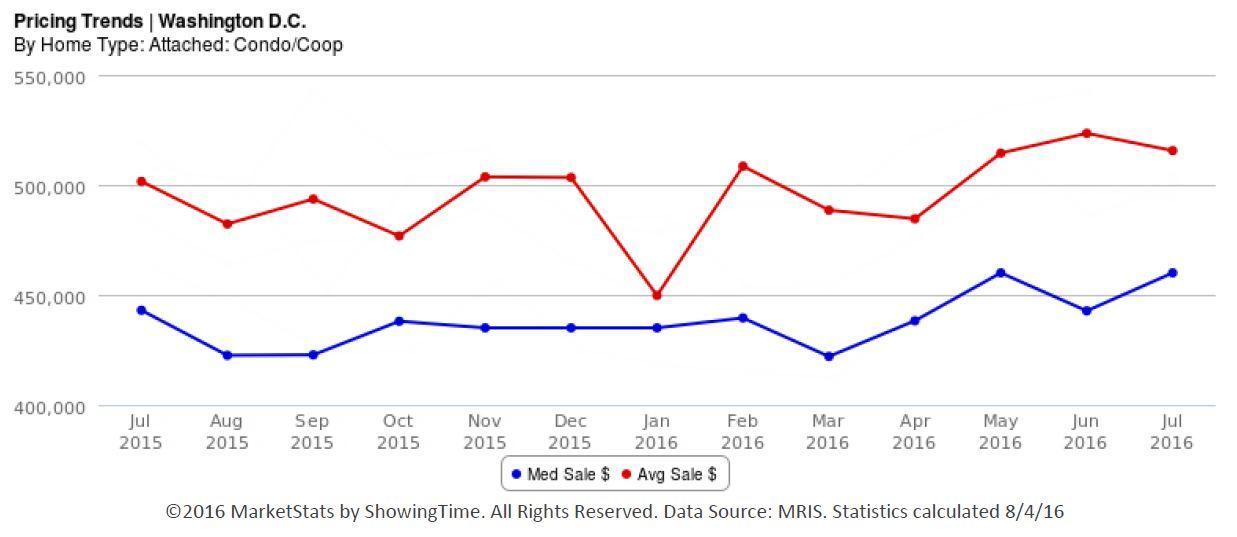
Condos & Co-ops
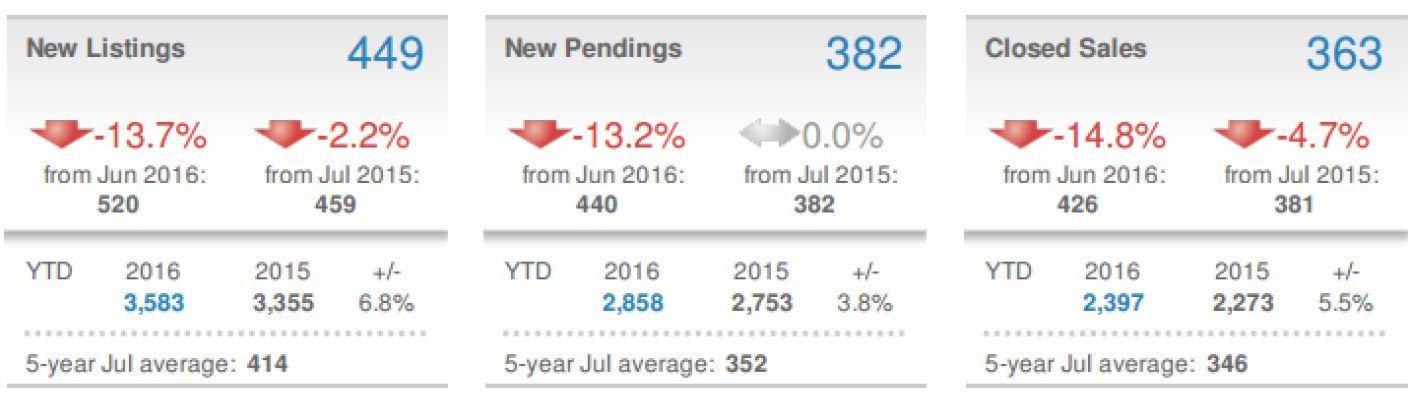
- There was slower growth in purchase activity in the condo/co-op segment, with the 382 new pending sales marking a flat line compared to the last July.
- The 363 closed sales in July were 4.7 percent less than the 381 sales last year and exceeded the five-year July average of 346 by 4.9 percent.
- The 449 new listings added in July represented a 2.2 percent decrease from last July but exceeded the fiveyear July average by 35 listings (+8.5 percent).
- The 611 active listings represent only 1.9 months of supply based on the average sales pace of the last 12 months, slightly favoring the sellers even more from the 2.1 months of supply last July.
- The average days-on-market (DOM) for condo/co-op units sold in July was 35 days, seven days slower than last year. Half of the condo/co-op units sold were on the market for 14 days or less, three days more than the 11-day median DOM of July 2015.
- The average price per square foot for condo/co-op units sold in July was $557, an increase of 3.1 from last July’s average of $540.
- The $460,000 median sales price for condo/co-op units represents a 3.8 percent increase from last July’s $443,000 level and the year-to-date median of $445,000 is only slightly higher than the $437,400 level last year. The average sales price in July was $515,556, a 2.8 percent increase from last July’s average of $501,558
MONTHLY HOME SALES INDEX - WASHINGTON DC - JULY 2016
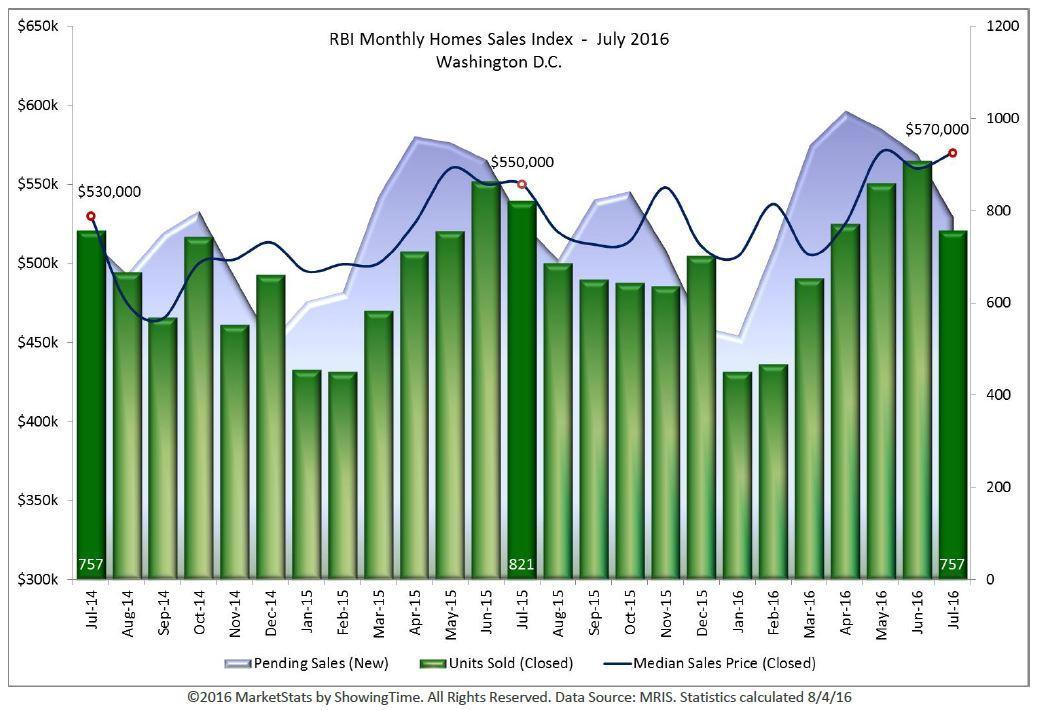
The Monthly Home Sales Index is a two-year moving window on the housing market depicting closed sales and their median sales price against a backdrop of pending sales activity. It provides unique insight into the state of the current housing market by measuring the number of sales and new pending contracts for each month through the most recent month. The results include sales and pending contracts through and including July 2016. The stats shown are for the Washington, DC real estate market.